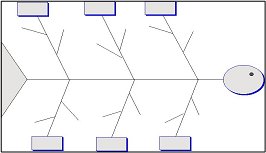


This tool is referred to by several different names: Ishikawa diagram, Cause-and-Effect diagram and Fishbone diagram. The first name is after the inventor of the tool, Kaoru Ishikawa (1969) who first used the technique in the 1960s.
The Fishbone Diagram is a skeleton of a fish. The fish skeleton consists of head, spine, ribs, and bones attached to the ribs. It is an organizing or problem-solving tool and is often used to visualize cause and effects of a decision. It can be used to show the various jobs to be done in an activity or project, to help sequence steps in a process, show the positive and negative aspects to a decision, and of course help show what is leading to a problem.
Fishbone Diagrams allow you to add ideas as they occur. If you write these ideas in a linear form, it is very difficult to add ideas. This kind of diagram allows you to see the various relationships between and among ideas. The linear format does not do this.
The Fishbone Diagram helps groups to organize their thoughts and work towards solutions. It is easy to learn and use. However, as with other group processes, it shouldn’t be used without learning group organizational skills, such as working with others, searching for the truth, being open to different ideas, seeing others who disagree with you as just ‘team mates’ with different ideas. Without training, internal politics can take over (e.g., the most powerful opinion dominates; or team members bring to the diagram construction personal agenda). The group should work through some samples with a facilitator before being left on their own.