The Social & Economic Landscape
Bridging the Gap: From Education to Employment, Pilot Phase II
Bridging the Gap: From Education to Employment, Pilot Phase II
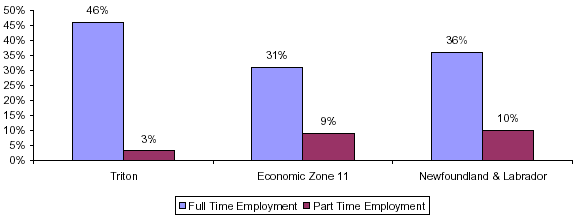
Proportion of Employment
The proportion of employment charts below reflect the number of full and part time workers as a percentage of total population (thus, the percentages do not add to 100). Triton has a notably higher proportion of full–time workers and a notably lower number of part–time workers (working less than 30 hours per week) when compared to the Economic Zone and the Province.
Proportion of Employment – Triton

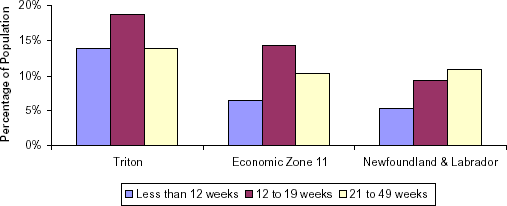
Seasonal Employment
Triton has a higher percentage of population working seasonal employment in categories across the board, but the most noticeable difference is in the 12 to 19 week category, and the much higher number of people in the Less than 12 weeks category.
Seasonal Employment - Triton
