Increasingly, in the economically advanced countries, the desired threshold level for good jobs is not high school completion but some college or university education. Net rates of entry into higher education already exceed 50 percent of a cohort of high school leavers in one-third of OECD countries, and rates continue to increase across the board. In the United States also, the percentage of high school graduates who immediately enroll in 2-year or 4-year colleges and universities has increased steadily over the past decade. Between 1992 and 1996, 39 states (out of 51) significantly increased their rates of transition to higher education. In states such as New York, Massachusetts and North Dakota more than 70 percent of high school graduates continue on to some form of post-secondary education.11
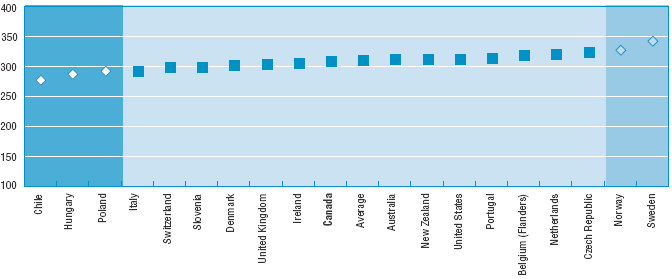
Figure 3 presents evidence on the literacy proficiency of the young population aged 20-25 with some experience of college or university. The graph shows the prose mean scores of populations across countries. Some countries with highly selective education systems will have a low rate of transition to higher education combined with a very high literacy profile among college students. Other countries will seek to combine high rates of transition with high levels of literacy. The data suggest that university students in Norway and Sweden—two countries with high rates of transition to tertiary education—outperform students in the other countries. College students in the United States perform a little higher than average in prose literacy, although the difference is not significant. Their level is the same as that of students in the majority of the countries studied, including the United Kingdom, Ireland, Canada, Australia, New Zealand and the Netherlands.
Mean prose scores on a scale with range 0-500 points, for those with some college or university education, population aged 20-25, 1992-1998

Legend:
![]() Nations with mean scores significantly lower than the United States
Nations with mean scores significantly lower than the United States
![]() Nations with mean scores not significantly different from the United States
Nations with mean scores not significantly different from the United States
![]() Nations with mean scores significantly higher than the United States
Nations with mean scores significantly higher than the United States
COUNTRIES ARE RANKED BY THE STATISTICAL DIFFERENCE TO THE UNITED STATES.
Note: Statistical difference is significant at p < .05.
Source: International Adult Literacy Survey, 1994-1998; US National
Adult Literacy Survey, 1992.
11. NCES data. See also OECD (2000), Education at a Glance, Paris, and National Education Goals Panel (1999), National Education Goals Report 1999, Washington, DC.