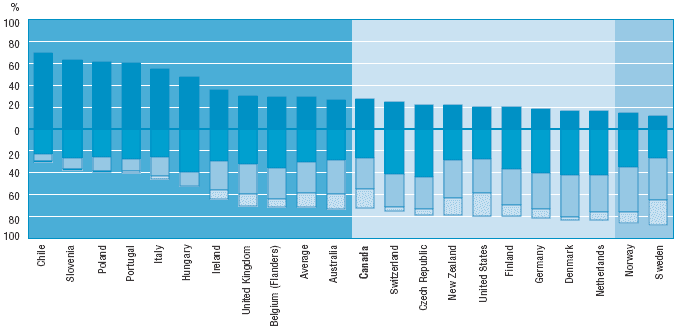
Percent of population aged 45-65 at each prose literacy level, 1994-1998

Legend:
![]() Nations with mean scores significantly lower than the United States
Nations with mean scores significantly lower than the United States
![]() Nations with mean scores not significantly different from the United States
Nations with mean scores not significantly different from the United States
![]() Nations with mean scores significantly higher than the United States
Nations with mean scores significantly higher than the United States
COUNTRIES ARE RANKED BY THE STATISTICAL DIFFERENCE TO THE UNITED STATES FOR THOSE AT LEVEL 1.
Note: Statistical difference is significant at p < .05.
Source: International Adult Literacy Survey, 1994-1998.
The final indicator in this monograph shows the percentage of native-born and secondlanguage foreign-born population aged 16-65 scoring at Level 1 on the prose literacy scale. The second-language foreign-born population refers to persons with immigrant background who used to speak a language other than the main national one(s). Thus, an English-speaking American living in Canada would be excluded but a Spanish-speaking Mexican immigrant into the United States would be included. In all countries but Italy and Portugal there are large differences in performance between the native-born and the foreign-born populations.13 The common tendency is for the foreign-born population to have much larger proportions at the lowest levels of literacy. This is the case in both Canada and the United States. Among the native-born population, 14 percent of Americans and 13 percent of Canadians perform at Level 1 on the prose scale. These proportions are 64 and 51 percent, respectively, for the second-language foreign-born population. Thus more than half of the immigrant population that arrived in the United States primarily speaking a language other than English or, in the case of Canada English or French, has very poor literacy skills in the languages tested. In European countries too there are large differences between the two population groups, for example in Germany and Switzerland.14
13. Some estimates for Portugal and Italy are unreliable because they are based on small sample sizes. This is also the case for Ireland and some other countries that have relatively small second-language immigrant populations. See flags in Table 10 in Annex A.
14. Switzerland undertook separate surveys of its German-, French- and Italian-speaking populations.