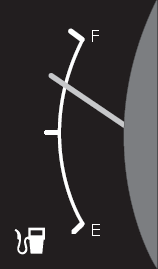
What makes this task more difficult than the previous ones described above is the fact that adults must first estimate the level of gas remaining in the tank, by converting the placement of the needle to a fraction. Then they need to determine how many gallons this represents from the 48 gallon capacity stated in the question or directive. Thus, this task requires adults to apply multiple operations or procedures to arrive at a correct response, without specifying what the operations may be. Nonetheless, this task, like many everyday numeracy tasks, does not require an exact computation but allows an approximation that should fall within reasonable boundaries.

A somewhat more difficult numeracy task, falling at the top of Level 2 and receiving a difficulty value of 275, requires adults to look at a diagram of a container on which there are four markings or lines; respondents are asked to draw a line on the container indicating where one-third would be. The top line is marked “1” while the middle line is marked with “1/2”. There are two other lines with no markings - one line midway between “1” and “1/2” and another midway between the line marked “1/2” and the bottom of the container. To respond correctly, adults need to mark a line on the container that is between the line marked “1/2” and the line below it indicating where one-quarter would be (although this line does not say “1/4” — this has to be inferred). Here the context may be less familiar to the respondent but again the visual image used is simple and realistic with virtually no text; the response expected does not involve writing a symbol or text, just drawing a line in a certain region on the drawing of the container. To answer this task correctly, adults need to have some working knowledge of fractions and a sense for proportions: they have to be familiar with the symbols for “1/2” and “1/3”, know how to order fractions in terms of their relative size and be able to relate them to the existing markings on the container.
Some numeracy tasks were developed around a short newspaper article titled “Is breast milk safe?” which relates to environmental hazards and food safety. The article contained two brief text paragraphs describing a toxin, Dioxin, found in fish in the Baltic Sea plus a graph with bars indicating the levels of Dioxin found at three points in time, namely 1975, 1985, and 1995, in the breast milk of North European women. One question asked adults to describe how the amount of Dioxin changed from 1975 to 1995, i.e., provide a straightforward interpretation of data presented in a graph. Adults were not required to actually calculate the amount of change over each of the periods, just describe in their own words the change in the levels of Dioxin (e.g., decreased, increased, stayed the same).