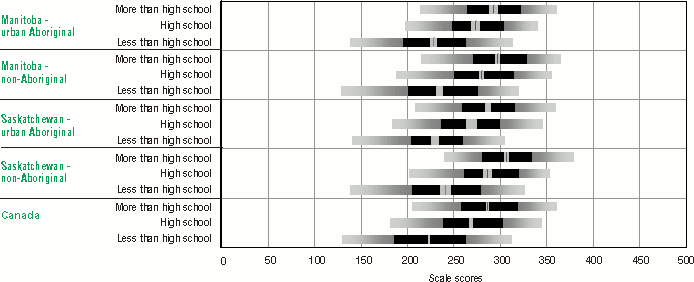
Average prose proficiency scores with .95 confidence interval and scores at the 5th, 25th, 75th
and 95th percentiles, by educational attainment, urban Aboriginal and non-Aboriginal populations,
Canada, Manitoba and Saskatchewan, population aged 16 and over, 2003


