SkillBuilder – Flow Charts
A flow chart: shows a sequence of steps in a process. It sometimes indicates the amount of time each step should take. Flow charts are an easy to read format for procedures that have many steps. Certain shapes have specific meanings in industry.
A circle, oval or rounded rectangle means the start or finish of a process. The start could mean addressing materials needed for a project, necessary information or actions which must be completed before the process gets underway, or the event which activates the process. The end means the final product or outcome. Sometimes ovals are used to mean starts or stops. A circle can also indicate a collector point where two paths come together.
A rectangle means a step or a task. Variations in rectangles (parallelograms, squares, etc.) can mean sub-steps or sub-processes.
A diamond means a decision point (an if/then point). A question is asked or a statement made. A yes or true answer results in one specific path or set of actions, and a no or false answer leads to a different path or set of actions.
Companies sometimes have specialized shapes that mean storage, handling, filing or packaging of materials or documents. Other specialized shapes sometimes used can refer to the recording of data on forms or reports and to the printing of forms.
Arrows indicate the direction of the process. Only one arrow leads to the next step.
A broken or dashed line means a separation between categories or areas of responsibility. It can also mean an indirect path between two points. Usually the flow chart starts at the top and works its way down the page. Text is short and to the point. A label or title explains the process being described.
Other common symbols:

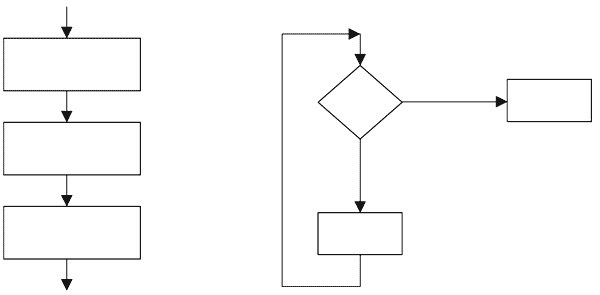
Flow chart examples:
