|
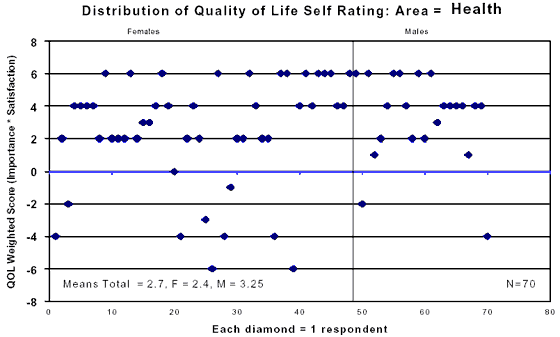
Participants’ Scattergraphs Scattergraphs of respondent scores on the QOL Inventory follow. Each symbol represents one individual. Maximum scores range from a low of –6 (unvalued and unsatisfied) to +6 (valued and highly satisfied). Each chart reflects a snapshot of 70 individuals ranking of their satisfaction in that area of their life. Health: Physical fitness, freedom from sickness and pain
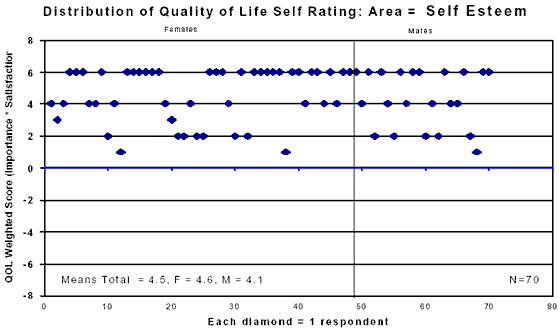
Self Esteem: Liking and respecting yourself, successes and failures and ability to handle problems.
|
| Previous Page | Contents | Next Page |