|
2.4 - Community College Course Enrollment
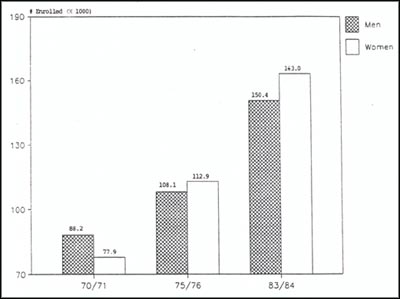
FIGURE 2 indicates changes in the number of women enrolled in
community colleges, while TABLE 6 shows changes in the type of courses taken by
women.
Together, they show:
- Overall enrollment in community colleges has continued to
increase from 1970/1971 to 1983/1984.
- From 1975/1976 to 1983/1984, women have marginally been in
the majority (51% of total enrolled in 1975/1976, 52% in 1983/1984).
- Substantial increases occurred in the Business area of
Management and Administration (from 44% in 1977/1978 to 50% in 1983/1984) and
in Natural Sciences (from 16% in 1974/1975 to 27% in 1983/1984).
- In spite of these gains, women in 1983/1984 continued to
enroll in typically "women's" areas (for example, 100% of Secretarial courses,
88% of Health Sciences, 74% of Education) and to be under represented in
non-traditional areas (e.g., women comprise 10% of Engineering students, 9% of
Electronics, 27% of Natural Science students).
FIGURE 2
Changes in Full - Time Community
College Enrollment of Women and Men 1970/1971 - 1983/1984
| Source: |
Statistics Canada, Education in Canada
(Annual) # 81 - 229 |
|