|
FIGURE 15
% of Women and Men 15+ in the
Labor Force:
Engaged in Full or Part-Time Work or Unemployed 1971 -
1985
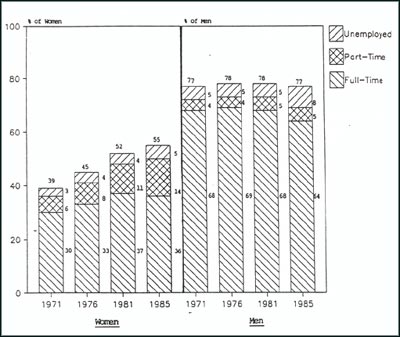
* Based on a sample of 52,800 households.
Source: Statistics Canada, The Labour Force, 1971, 1976,
1981, 1985
TABLE 18 and FIGURES 16 and 17 provide information about the
reasons for the increase in women's part-time work.
TABLE 18 examines whether women now combine part-time work with
part or full-time education and whether there has been a change in this
practice from 1971 to 1981. It shows that working women in 1981 were a little
more likely to combine work with part-time studies than in 1971. However, the
large increase in part-time work cannot be accounted for entirely by increases
in school attendance. There appears to be one group of women who attend school
part-time. and a different group who work part-time.
TABLE 18
CHANGE IN
RELATIONSHIP BETWEEN PART-TIME WORK AND
SCHOOL ATTENDANCE OF THOSE
15+
1971 - 1985
% of Group in Each School Attendance Status
|
Worked |
Worked |
|
|
Full-Time |
Part-Time |
Did Not Work |
|
1971 |
1981 |
1971 |
1981 |
1971 |
1981 |
|
% |
% |
% |
% |
% |
% |
| |
|
|
|
|
|
|
| School Attendance |
|
|
|
|
|
|
| |
|
|
|
|
|
|
| Women (Total) |
100 |
100 |
100 |
100 |
100 |
100 |
| Full time |
6 |
6 |
20 |
20 |
14 |
12 |
| Part time |
6 |
10 |
4 |
6 |
2 |
2 |
| Not in school |
88 |
84 |
76 |
74 |
85 |
86 |
| |
|
|
|
|
|
|
| Men (Total) |
100 |
100 |
100 |
100 |
100 |
100 |
| Full time |
7 |
5 |
47 |
40 |
34 |
26 |
| Part time |
6 |
7 |
4 |
4 |
1 |
1 |
| Not in school |
87 |
88 |
49 |
56 |
65 |
73 |
* Source: Census of Canada, 1971, 1981. |