|
FIGURE 25 illustrates that the income of women has continued to
increase, albeit slowly, relative to that of men:
- Women's earnings were 59% of men's in 1970; 68% of men's
earnings in 1985.
FIGURE 25
Changes in Average Annual
Earnings of Women Full-Time
Workers Age 15+ Compared to Men Full-Time
Workers, 1970 - 1985
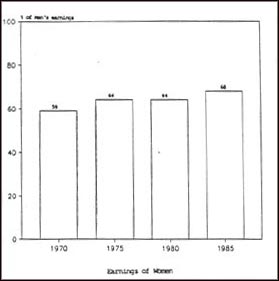
Source: Statistics Canada, Census of Canada,
1971 and 1981 and Income Distributions by Size in Canada, Cat. #
13-207
FIGURE 26 indicates that, for full-time work, women's earnings
have increased relative to men's across most education levels, from 1971 to
1982; (i.e., no systematic difference is apparent based on education level).
Boulet and Lavallee* have recently analyzed the sources of this
continuing income gap and attribute it to four basic causes which are examined
next:
- There are very few women in the highest income groups.
- Women tend to work fewer hours per year than men (i.e., more
part-time workers are women than men).
- Women are concentrated in narrow, traditionally defined
"women's" jobs.
- Women are not yet paid equally for work of equal value.
FIGURE 26
Relative Average Earnings of
Full-Time Women Workers
with Various Levels of Education
1971-1982
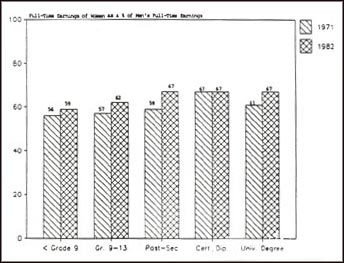
Source: Statistics Canada, Women in Canada,
1985
* Boulet, J. and Lavallee, L. The Changing Economic Status of
Women, 1984. |