|
4.5 - Income And Poverty
FIGURE 30 and TABLES 30 and 31 illustrate that the end result of
women's unequal access to education, training, and employment is low
income.
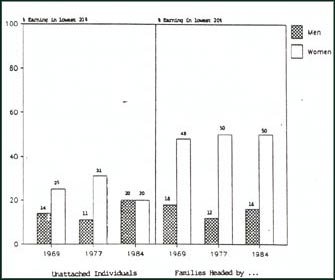
FIGURE 30 describes the composition of the 20% of families in
Canada that have the lowest incomes and the 20% of unattached individuals in
Canada who have the lowest incomes.
The FIGURE shows:
- In the past, women were overrepresented among the 20%
poorest unattached individuals (i.e., in 1977, this group comprised 31% of all
unattached women and 11% of unattached men). However, in 1984, men and women
were represented equally among this group.
- Family poverty. however. is largely a female problem. a
situation that has not improved over the Decade. The poorest 20% of Canadian
families consist of 16% of all male-headed families (12% in 1977) and 50% of
all female- headed families in both 1977 and 1984.
FIGURE 30
Female/Male Composition of the
Lowest 20% Income Groups of unattached
Individuals and Families Age 15-64,
1969 - 1984
Source: Statistics Canada, Women in Canada,
1984 |