

Section 2 - Examples of Materials


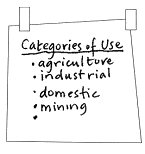
Now write on the flipchart and explain the 5 major categories of use as follows:
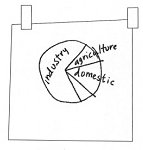
Draw a large circle on the flipchart and explain that you are going to cut the pie to show how much of canada's total water consumption is used by each category. To begin, ask participants to guess which category uses the most water. Which category is the biggest user? Have someone volunteer to draw a piece of the pie to show how much water is used by the biggest user. Label the piece. Now ask participants to guess which category uses the least water. which category is the smallest user? Again have someone volunteer to draw and label the piece of the pie for this category. Continue with the other categories. Since there will be differences of opinion in the group, you may want to draw a second pie and repeat the exercise with other volunteers.
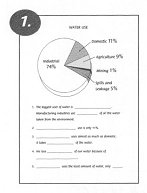
Now distribute the Water Use hand-out # 1. Compare the pie chart on the hand-out with the group's pie charts. Discuss any surprises and reflections. Have participants do the sentence completion exercise on the hand-out. Read aloud to check. If relevant, work with the group to go through the process of converting percentages to fractions and reducing the fractions where possible.
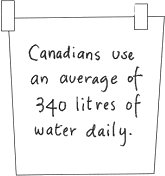
Write the following sentence on the flipchart.
Ask what participants think this means. Does it mean we each use 340 litres a day? what does average mean? How do we arrive at this average? what is the calculation? We start with the total use and divide it by the number of people in Canada - the population. But what number do we use for the total use? If we use the total for domestic use and divide that by the total population, then 340 litres reflects average personal domestic use.