The Social & Economic Landscape
Bridging the Gap: From Education to Employment, Pilot Phase II
Bridging the Gap: From Education to Employment, Pilot Phase II
Prosperous People
This section presents information primarily concerned with income and employment. Although related to self-reliance, it is more a measure of the quality of life (in a limited economic sense) in an area as opposed to its self-sufficiency.
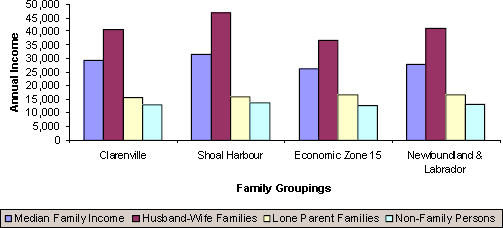
As the graph below indicates, the Clarenville and Shoal Harbour communities have higher than average family incomes than both economic zone 15 and the province, and are approximately equal with regard to lone-parent families and non-family persons. This correlates with the employment charts found next—the Clarenville and Shoal Harbour communities have higher employment rates and lower unemployment than their zonal and provincial counterparts.
Average Annual Household Income—1999

Source: Compiled by the Community Accounts Unit, based on Canada Customs and Revenue Agency summary information as provided by Small Area and Administrative Data Division, Statistics Canada.
Labour Force with Annual Employment
| Census - Labour Markets, 1995-96: Labour force (May 1996): Employment rate | Prime Labour Force Age | Age 15 and Over |
|---|---|---|
| Clarenville | 67% | 50% |
| Shoal Harbour | 71% | 55% |
| Economic Zone 15 | 51% | 35% |
| Newfoundland & Labrador | 58% | 42% |