The Social & Economic Landscape
Bridging the Gap: From Education to Employment, Pilot Phase II
Bridging the Gap: From Education to Employment, Pilot Phase II
Unemployment Rate
| Census - Labour Markets, 1995-96: Labour force (May 1996): Unemployment rate | Prime Labour Force Age | Age 15 and Over |
|---|---|---|
| Clarenville | 15% | 18% |
| Shoal Harbour | 12% | 16% |
| Economic Zone 15 | 28% | 31% |
| Newfoundland & Labrador | 23% | 25% |
Source: Compiled by the Community Accounts Unit based on custom tabulations from the Census of Population 1996, Statistics Canada.
Proportion of Employment
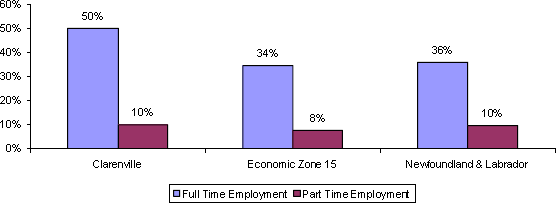
The proportion of employment charts below reflect the number of full and part-time (working less than 30 hours per week) workers as a percentage of total population (thus, the percentages do not add to 100). Keeping with the trend established above, the Clarenville and Shoal Harbour communities have much higher proportions of full-time employment than the economic zone and the province.
Proportion of Employment - Clarenville
