The Social & Economic Landscape
Bridging the Gap: From Education to Employment, Pilot Phase II
Bridging the Gap: From Education to Employment, Pilot Phase II
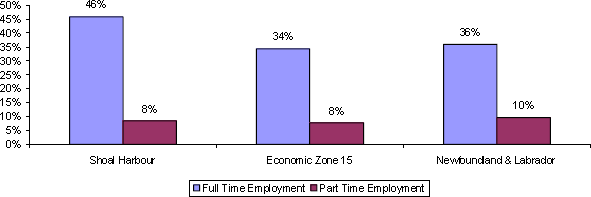
Proportion of Employment - Shoal Harbour

Notes: Age 15 and over; Figures may not add to totals due to random rounding. Extracted from Labour Market Accounts, Labour Market Profile, Clarenville, Economic Zone 15, and Newfoundland & Labrador. Source: Compiled by the Community Accounts Unit based on custom tabulations from the Census of Population 1996, Statistics Canada.
Seasonal Employment
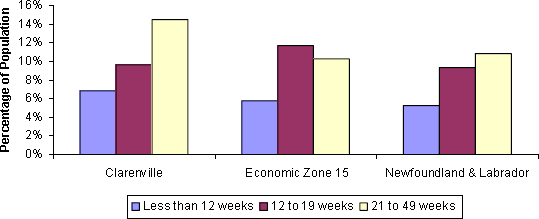
The distribution of weeks among seasonally employed workers in the Clarenville and Shoal Harbour communities are very similar in proportion, with Clarenville having slightly higher numbers over all. Compared to the zone and province, both communities have more workers employed in the 21 to 49 week period, and less employed in the 12 to 19 week period, with the numbers in the under 12 week period being approximately equal.
Seasonal Employment - Clarenville
