The Social & Economic Landscape
Bridging the Gap: From Education to Employment, Pilot Phase II
Bridging the Gap: From Education to Employment, Pilot Phase II
People Living within Sustainable Communities/Zones
This section presents information with regard to the sustainability of communities. One of the key indicators of a sustainable community is a diversified economy.
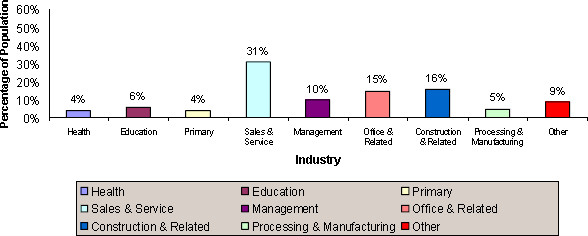
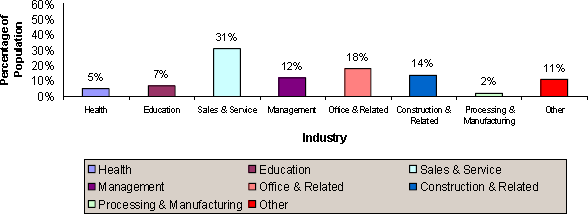
The graphs below demonstrate the main industries in the Clarenville and Shoal Harbour communities, and the percentage of the population they employ. In both communities, "Sales and Service" is the single largest sector, employing close to one-third of the workforce.
Main Industries
Main Industries - Clarenville

Main Industries - Shoal Harbour

Figures may not add to totals due to random rounding. Figures based on 1991 Standard Occupational Classification. Source: Compiled by the Community Accounts Unit based on custom tabulations from the Census of Population 1996, Statistics Canada.