Values on the index of prose literacy inequality range from a low of 1.3 for Denmark, Finland and Norway to 1.7 for New Zealand, Poland, Portugal and the United Kingdom. With an index value of 1.6, inequality in the distribution of literacy scores among the young population in the United States is slightly lower and similar to that among youth in Chile, Italy and Slovenia. The distribution of literacy scores among U.S. youth is consistent across the three scales. This is not the case for Poland and the United Kingdom, for example, where the range of inequality is even larger for the document and quantitative scales than for prose. In the majority of the countries literacy inequality is lower than inequality in Canada and the U.S. Inequality is lowest in the four Nordic countries. Separate data analyses have shown not only that young people in Denmark, Finland, Norway and Sweden have high levels of literacy on average but also that little of the observed variation in skills is attributable to differing levels of parental education.12
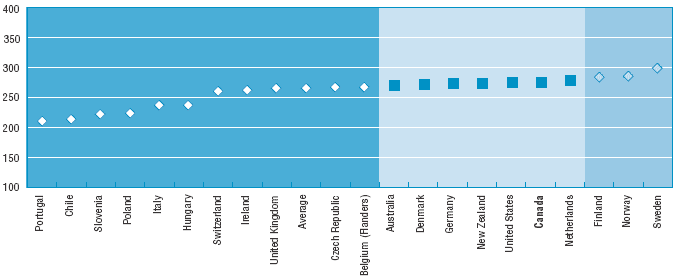
Figure 5 presents evidence on the prose literacy performance of the entire adult population aged 26-65. Scores on the prose scale with a range from 0-500 points range from 209 points in Portugal to 298 points in Sweden. This indicates that there is a large spread in scores between the comparison countries. The mean score for the U.S. adult population is significantly above average, at 277 points. This puts the American population at the same level of literacy proficiency as the populations of Australia, Denmark, Germany, New Zealand, Canada and the Netherlands. Americans significantly outperform the adult populations of a range of countries: Portugal, Chile, Slovenia, Poland, Italy, Hungary, Switzerland, Ireland, the United Kingdom, the Czech Republic and Belgium (Flanders). Given the large linguistic and cultural heterogeneity of the American population relative to that of many comparison countries, this could be considered a good result. The U.S. literacy scores are somewhat lower on the document scale. In only three countries are the test scores significantly higher than in Canada and the United States: Finland, Norway and Sweden.
Mean prose scores on a scale with range 0-500 points, population aged 26-65, 1994-1998

Legend:
![]() Nations with mean scores significantly lower than the United States
Nations with mean scores significantly lower than the United States
![]() Nations with mean scores not significantly different from the United States
Nations with mean scores not significantly different from the United States
![]() Nations with mean scores significantly higher than the United States
Nations with mean scores significantly higher than the United States
COUNTRIES ARE RANKED BY THE STATISTICAL DIFFERENCE TO THE UNITED STATES.
Note: Statistical difference is significant at p < .05.
Source: International Adult Literacy Survey, 1994-1998.
12. See OECD and Statistics Canada (2000). Literacy in the Information Age: Final Report of the International Adult Literacy Survey, Paris and Ottawa.