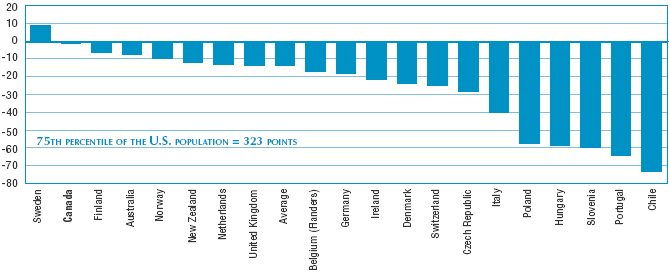
Policy makers are interested not only in the mean level of literacy proficiency but also in the way the literacy scores are distributed among the population. In some countries, Denmark for example, this distribution is tight, indicating small differences between those performing at the top and those at the bottom. Other countries will have a large spread in scores. Figure 6 presents prose literacy scores at the 75th percentile. The evidence shows that Americans (323 points) and Canadians (322 points) score second to Swedes (332 points) but similarly or higher than all other comparison countries. Thus North America has a high level of literacy ability at the top end of the population distribution. Relative to population size the 'pool of talent' at the top end of the literacy distribution is larger in North America compared with Europe.
Score difference to the 75th percentile of the United States on a scale with range 0-500 points, prose literacy scale, population aged 26-65, 1994-1998

COUNTRIES ARE RANKED BY THE DIFFERENCE TO THE 75TH PERCENTILE OF THE UNITED STATES.
Source: International Adult Literacy Survey, 1994-1998.