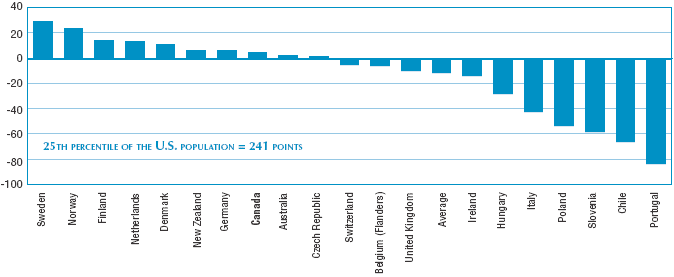
Figure 7 presents evidence on the level of literacy at the bottom 25th percentile of the population distribution. The prose literacy score of Americans and Canadians at the 25th percentile is average and similar to the scores of adults in Australia, Canada and the Czech Republic. Scores of adults at the bottom quarter are significantly higher than Canada and the U.S. in the Nordic countries, the Netherlands and New Zealand. In contrast, the bottom quarter of Americans and Canadians outperform adults in countries such as Ireland, Italy, Switzerland and the United Kingdom.
Score difference to the 25th percentile of the United States on a scale with range 0-500 points, prose literacy scale, population aged 26-65, 1994-1998

COUNTRIES ARE RANKED BY THE DIFFERENCE TO THE 25TH PERCENTILE OF THE UNITED STATES.
Source: International Adult Literacy Survey, 1994-1998.
Indicator 8 presents summary information about the extent of inequality in the distribution of prose literacy scores. The index values are very high for Portugal, Poland, Slovenia and Italy, suggesting a very large degree of literacy inequality in these countries. This result is due to the low average performance of a large group of adults at the bottom of the distribution. Canada and the United States have the same inequality index. A value of 1.9 indicates considerable inequality in the distribution of adult literacy in North America. In contrast, Australia, New Zealand and most of the Western European countries have a more equal distribution. Variations in average and range point to important characteristics of a country's skill profile. Issues of equity arise where there are large differences between the people with the lowest and the highest literacy skills, as is the case in both Canada and the United States.