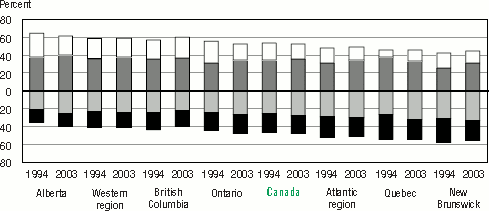
Figure 1.5 A and B shows that there have been some slight shifts in the distribution of proficiency between 1994 and 2003. In general, the proportions at the lowest and highest levels have diminished while the proportions in the middle have grown correspondingly. In other words, there appear to be fewer Canadians at the highest and lowest literacy levels in 2003 than in 1994 and more at Levels 2 and 3. Few of the observed changes are statistically significant, however. Accordingly, the cautious conclusion is that there has been little change in the literacy profiles of Canadians between 1994 and 2003.
Figure 1.5 A and B
Notes: The Western region includes Manitoba, Saskatchewan, Alberta
and British Columbia.
The Atlantic region includes Newfoundland and Labrador, Nova
Scotia, New Brunswick and Prince Edward Island.
The northern territories are excluded from the Canadian average.
Regions and provinces are ranked in descending order according
to the percentage above Level 2 in 1994.
Source: International Adult Literacy Survey, 1994; International Adult Literacy and Skills Survey, 2003.