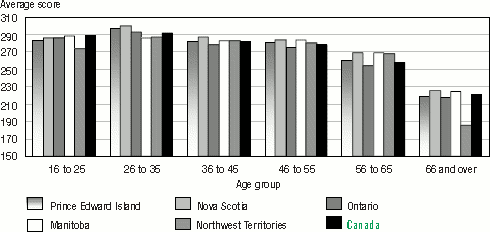
Figure 2.3B
Average prose scores, by age group, provinces and territories
with scores
similar to the Canadian average, population aged 16 and over,
2003
Source: International Adult Literacy and Skills Survey, 2003.
Figure 2.3C
Source: International Adult Literacy and Skills Survey, 2003.