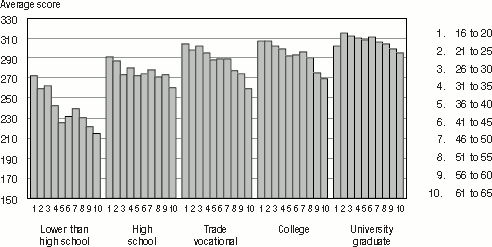
Figure 2.10
Note: This figure contains certain unreliable estimates.
Consult the table 2.10 in Annex A for the standard error of each estimate.
Source: International Adult Literacy and Skills Survey, 2003.
Text table 2.1
High school not completed |
High school |
Trade vocational |
Non-university post-secondary |
University |
||||||
|---|---|---|---|---|---|---|---|---|---|---|
| Mean | Standard error |
Mean | Standard error |
Mean | Standard error |
Mean | Standard error |
Mean | Standard error |
|
| Newfoundland and Labrador | 219 | (3.3) | 274 | (3.9) | 277 | (4.2) | 290 | (4.4) | 314 | (3.0) |
| Prince Edward Island | 230 | (4.3) | 279 | (4.3) | 276 | (5.3) | 294 | (6.2) | 318 | (5.4) |
| Nova Scotia | 237 | (3.5) | 280 | (2.8) | 290 | (4.3) | 289 | (5.7) | 317 | (3.8) |
| New Brunswick | 225 | (4.2) | 267 | (3.7) | 272 | (5.7) | 292 | (5.5) | 308 | (6.0) |
| Quebec | 223 | (2.1) | 267 | (1.8) | 285 | (2.9) | 283 | (2.6) | 303 | (2.5) |
| Ontario | 225 | (2.6) | 271 | (2.5) | 279 | (4.8) | 289 | (3.6) | 302 | (2.5) |
| Manitoba | 235 | (3.4) | 280 | (2.4) | 287 | (4.9) | 293 | (4.8) | 306 | (3.4) |
| Saskatchewan | 242 | (5.1) | 287 | (4.7) | 292 | (4.9) | 302 | (5.3) | 321 | (4.8) |
| Alberta | 242 | (4.3) | 285 | (3.0) | 287 | (5.8) | 293 | (3.8) | 316 | (3.7) |
| British Columbia | 238 | (3.5) | 282 | (2.6) | 291 | (4.7) | 298 | (3.5) | 312 | (3.9) |
| Yukon | 247 | (4.7) | 294 | (3.6) | 297 | (5.4) | 302 | (7.2) | 322 | (4.4) |
| Northwest Territories | 229 | (5.1) | 285 | (6.1) | 277 | (6.9) | 295 | (4.7) | 321 | (4.7) |
| Nunavut | 197 | (3.9) | 266 | (5.2) | 245 | (12.5) | 268 | (16.1) | 310 | (5.8) |
| Canada | 229 | (1.1) | 274 | (1.3) | 284 | (2.0) | 290 | (2.0) | 306 | (1.5) |
Source: International Adult Literacy and Skills Survey, 2003.