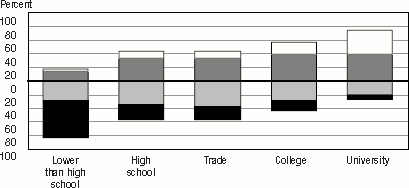
Figure 2.9C
Source: International Adult Literacy and Skills Survey, 2003.
Figure 2.9D
Note: This figure contains certain unreliable estimates.
Consult the table 2.9D in Annex A for the standard error of each estimate.
Source: International Adult Literacy and Skills Survey, 2003.
As shown in Figure 2.10, education appears to moderate the relationship between literacy proficiency scores and age. The decrease in prose literacy proficiency among higher age groups, noted at the beginning of the chapter, is much more pronounced for individuals with less than a high school education than for those with higher levels of education. For example, for those with less than high school there is a 48 point difference in the average prose literacy score between those aged 26 to 30 years and those aged 61 to 65 years. For these same age groups, the difference is 17 points for individuals with a university education.