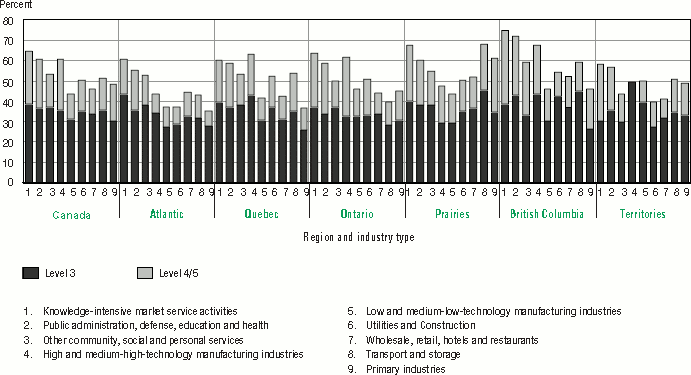
Figure 4.6A
1. The labour force population is defined as respondents who are either employed or unemployed (looking for work).
Note: This figure contains certain unreliable estimates. Consult the table 4.6 in Annex A for the standard error of each estimate.
Source: International Adult Literacy and Skills Survey, 2003.
In all regions, knowledge-intensive market services and public administration, defence and education industries have high proportions of highly proficient workers. There are, however, some notable regional differences. In the Atlantic region, Quebec, and Ontario about one in ten workers in the primary industries are at Level 4/5 prose, document and numeracy proficiency. In contrast, in the Prairies, British Columbia, and the Territories, about one in five workers in the primary industries are at this highest level of proficiency. This difference in worker profile is likely a reflection of the nature of the primary industries in these regions.