a fact that raises questions about the adequacy of supply...
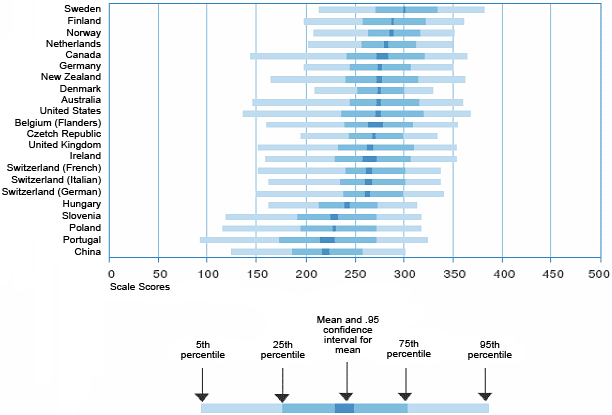
FIGURE 2.1
DISTRIBUTION OF LITERACY SCORES
A. Mean scores with .95 confidence interval and scores at 5th, 25th, 75th and
95th percentiles on the prose literacy scale, population aged 16-65, 1994-1998