| Education level | % of full-time workers in low-wage jobs7 |
|---|---|
| Less than high-school | 26.3 |
| High-school graduate | 20.7 |
| Trades/college certificate | 13.5 |
| University degree | 6.5 |
Source: Adapted from Saunders, 2005.
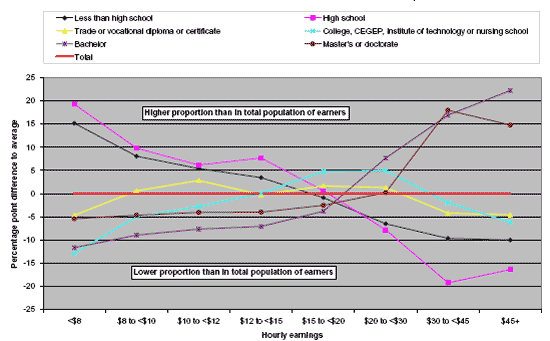
Over-representation of less-educated in low-paid jobs (2001)
Source: Workplace and Employee Survey (2001)
Table 2.7 shows the median weekly wage earned by full-time, employed workers with differing levels of educational achievement over the past 20 years, as a fraction of the median weekly wage earned by all full-time, employed workers. The top panel presents data for all workers from ages 25-64, while the bottom panel looks at workers relatively new to the labour force (those aged 25-29). Three findings are relevant here.
7 ‘Low-wage jobs’ are defined here as those with a wage less than $10/hr. Full-time work at $10/hr would give an individual an annual income approximately equal to the before tax low income cut-off (LICO) for a single, unattached person in a large urban area (Saunders, 2005).