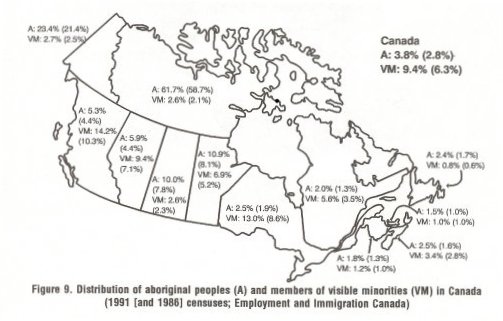
Geographic distribution of equity groups
Canada's challenges are not only related to the demographic trends and the increasing diversity of its population and labour force, but also to the uneven distribution of the population and its components across the country (Figure 9). The provinces east of Ontario have a lower than average proportion of both visible minorities and aboriginal peoples; the other provinces show a higher share of one or both of these groups. In British Columbia, the population of visible minorities increased by 57% between 1986 and 1991, the aboriginal population by 36%, but the total population by only 14%.
Also significant is the age distribution of aboriginal peoples and members of visible minorities compared with the overall population. In 1986, 21 % of the total population of British Columbia was under 15 years of age, compared with 26% of members of visible minorities and 35% of aboriginal peoples. This difference is leading to the growing presence of these equity groups in the labour force. The situation is similar in the other three western provinces. This geographic distribution must be considered in the provision of adequate support services.