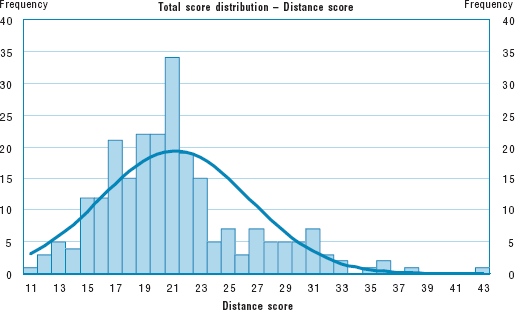
Figure 2 (Panel A)
Total score characteristics: US sample

Standard deviation = 5.31
Mean = 21.2
Number = 230.00
Mean = 21.2
Number = 230.00
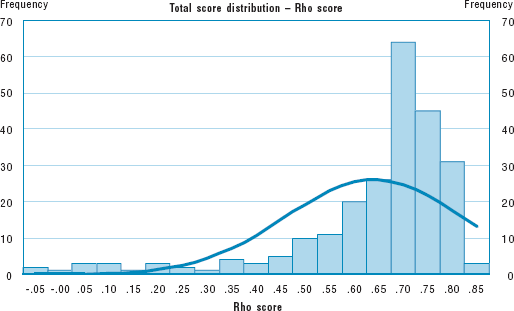
Figure 2 (Panel B)
Total score characteristics: US sample

Standard deviation = .18
Mean = .64
Number = 230.00
Mean = .64
Number = 230.00