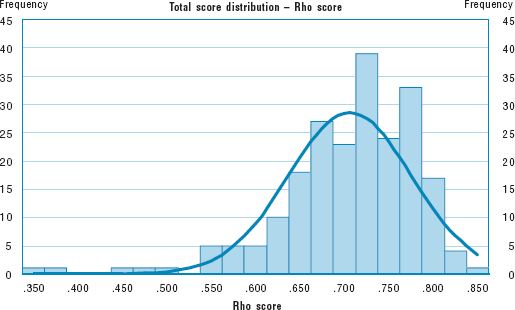
Figure 2 (Panel E)
Total score characteristics: Spanish sample

Standard deviation = .07
Mean = .706
Number = 227.00
Mean = .706
Number = 227.00
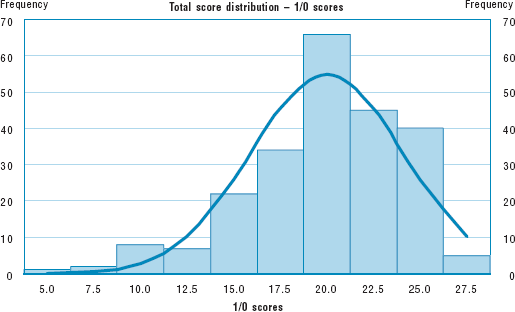
Figure 2 (Panel F)
Total score characteristics: Spanish sample

Standard deviation = 4.07
Mean = 20.0
Number = 227.00
Mean = 20.0
Number = 227.00