|
2.6 - Graduate University Enrollment
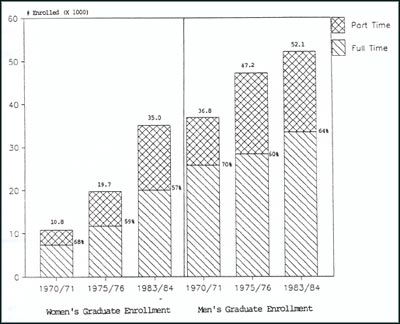
FIGURES 6 and 7 display trends in the enrollment of women in
graduate school from 1970 to 1984. FIGURE 6 shows overall trends while FIGURE 7
shows the increase in women's share of graduate enrollment in various fields of
study.
As with undergraduate enrollment. during this time period there
has been:
- An increase in the number of women enrolled in graduate
school, particularly on a part-time basis. However, their overall share of
graduate enrollment (40%) should still be higher, especially in non-traditional
disciplines where it remains unacceptably low.
Over the Decade, the
increase in women's graduate enrollment has been larger than men's, but the
rate of growth accelerated only slightly after 1975.
- An increase in women's share of enrollment in both
traditional and non-traditional disciplines.
Any growth in women's
participation in non-traditional areas of study is especially important because
women have accounted for such a small proportion of students in these
disciplines in the past. In addition, degrees in these non-traditional fields
open the way to future jobs in growth sectors of the economy.
Continuing support and encouragement of women is needed to further
increase their enrollment in all areas and particularly in Maths,
Physical Sciences, Engineering and Applied Sciences.
FIGURE 6
Changes in Graduate Enrollment of
Women and Men
1970/71 to 1983/84
Source: Statistics Canada, Education in Canada
(Annual) #81-229 |