|
FIGURE 7
Changes in Enrollment of Women in
Selected Areas of Graduate Study
1970/71, 1975/76 and 1983/84
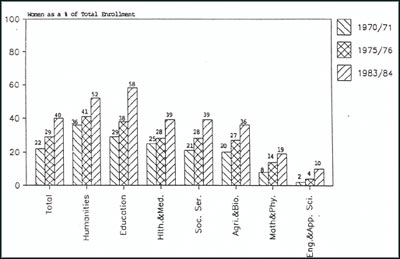
Source: Statistics Canada, Education
Statistics (Annual) #81-002
2.7 - Women In Education Leadership
TABLE 8 illustrates a disturbing trend concerning the role
models presented to female students. This TABLE shows the participation of
Canadian women in education leadership between 1975/1976 and 1983/1984. Despite
small gains in some areas, there has been very little real gain for women
overall.
For example:
- the percentage of women Vice-Principals and Principals at
the secondary level increased from 20% to 21% and from 7% to 9% respectively
during this time
- the percentage of women Vice-Principals at the elementary
level increased from 22% to 24% while the percentage of women elementary
Principals did not increase at all
- the percentage of women Community College senior
administrators rose from 18% to 24%
- the percentage of women senior administrators in
universities increased from 7% to 9%.
Thus, female students continue to be as likely to have male
administrators from elementary school through university as they were in the
past. They are also likely to have exclusively male educators in university and
community college Maths, Physical Sciences, Engineering and Applied Sciences
courses. |