|
FIGURE 13
Changes in Percentage of Canadian
Women Age 15+
who are in the Laror Force 1901 - 1985
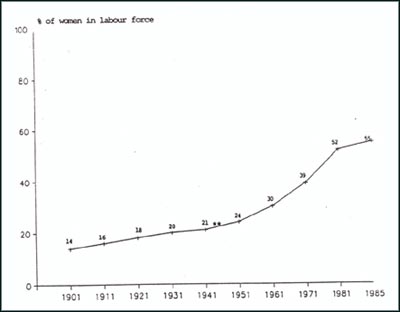
* Note that in 1901 and 1911, the age limit
was 10+, in 1921, the age was 14+.
Labor force participation includes both
employed women and those actively seeking work.
** Does not adequately represent women's
labor force participation during World War II.
Source: Statistics Canada: Census of Canada,
1981
TABLE 15
LONG TERM TRENDS
IN PARTICIPATION
IN THE LABOUR FORCE OF WOMEN AGE 15-64
1921
- 1985
| Year: |
1921 |
1931 |
1941 |
1951 |
1961 |
1971 |
1981 |
1985 |
| Total % |
18 |
20 |
21 |
24 |
30 |
39 |
52 |
55 |
|
|
|
|
|
|
|
|
|
| Age Category |
|
|
|
|
|
|
|
|
| |
|
|
|
|
|
|
|
|
| 15-24 % |
29 |
33 |
41 |
42 |
41 |
49 |
61 |
71 |
| 25-34 % |
17 |
24 |
25 |
24 |
30 |
44 |
66 |
69 |
| 35-44 % |
11 |
13 |
16 |
22 |
31 |
44 |
64 |
69 |
| 45-54 % |
11 |
13 |
13 |
20 |
33 |
44 |
56 |
60 |
| 55-64 % |
10 |
13 |
10 |
14 |
24 |
34 |
42 |
34 |
* Census of Canada for each year specified.
TABLE 16 shows that:
- In 1985, women no longer appear to leave paid employment to
attend exclusively to their household and family responsibilities, but are
working continuously through their childbearing years.
|