|
TABLE 16 RECENT LABOUR
FORCE PARTICIPATION* OF WOMEN AGE 15-64
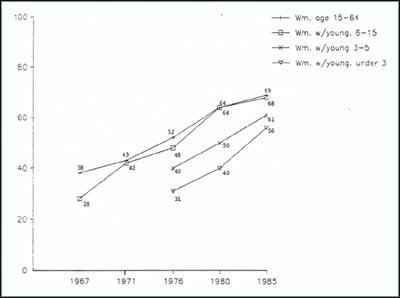
Source: Statistics Canada. The Labor Force Survey (Monthly) #71-001. FIGURE 14 shows increases in the labor force participation of women who have children under 3 years old, children who are between 3-5 years old and children of school age only. It confirms the recent acceleration of labor force participation among women with young children. FIGURE 14 Changes in Labor Force
Participation of Women With
Source: Statistics Canda, Characteristics of Women in the Labor Force, 1984 The Labor Force, #71-001 |
| Back | Contents | Next |