|
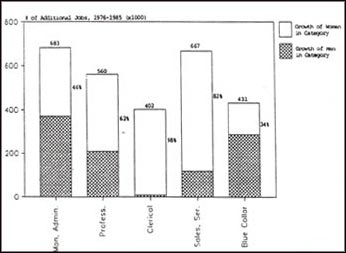
FIGURES 23 and 24 highlight the growth of women's participation within occupations over the Decade. FIGURE 23 shows the number of additional women and men employed in selected categories while FIGURE 24 compares women's share of the growth of the categories to their share of the category in 1975. Where women's share of the growth is higher than their 1975 share, this indicates an increasing share of the occupational category. From FIGURE 23 note:
FIGURE 23 Growth in numbers of women and
men employed in various
Source: Derived from Statistics Canada, The Labor Force (Monthly), Cat. #71-001 |
| Back | Contents | Next |