|
TABLE 1
Women Employees as a Percentage of Major
Occupational Groups,
Canada - 1984
|
Women as a |
| Occupational Group |
% of Total Employees |
| Clerical |
79.1% |
| Service |
55.8% |
| Managerial, Professional |
44.4% |
| Sales |
43.4% |
| Material Handling and Other Crafts |
20.9% |
| Processing |
20.8% |
| Primary Occupations |
19.2% |
| Transportation |
7.0% |
| Construction |
1.8% |
|
Source: Ontario Women's Directorate, Fact Sheet #2, no date.
CHART 1
Female Part-Time Employment:
"Involuntary" as
a Proportion of Total,
Canada, 1976, 1982, and 1985
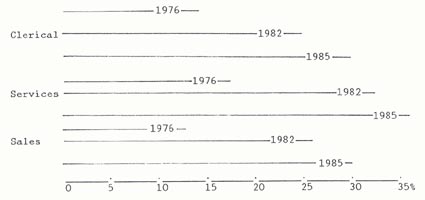
Source: Economic Council of Canada, Innovation
and Jobs in Canada (1987), p. 138. |