|
CHART 6
Changes in Average Annual Earnings of Women
Full-Time
Workers Age 15+ Compared to Men Full-Time Workers, 1970-1985
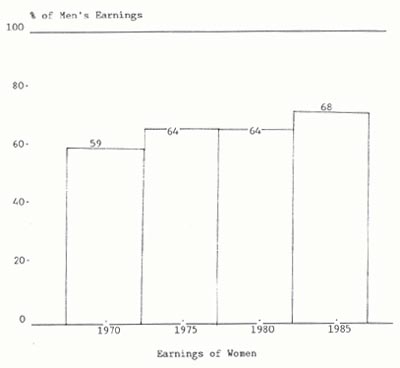
Source: Statistics Canada, Census of Canada, 1971 and 1981 and
Income Distribution by Size in Canada, Cat. # 13-207 (in Avebury Research and
Consulting, Decade of Promise, 1984, p. 98).
TABLE 8
Women in the Labour Force
Changes in
Occupational Segregation:
Employment by Occupational Group, 1973 and 1983
|
|
|
Women as |
|
|
|
a % of |
|
Women |
Men |
Employment |
|
1975 |
1983 |
1975 |
1983 |
1975 |
1983 |
|
% |
% |
% |
% |
|
|
| Clerical |
36.1 |
32.6 |
6.9 |
6.4 |
75.0 |
78.7 |
| Service |
16.6 |
18.6 |
9.7 |
11.3 |
49.6 |
54.3 |
| Sales |
10.4 |
10.4 |
11.5 |
10.8 |
34.0 |
41.1 |
| Medicine and Health |
9.5 |
9.2 |
1.7 |
2.0 |
75.7 |
77.1 |
| Teaching |
7.2 |
6.2 |
2.9 |
3.2 |
58.3 |
58.3 |
| Managerial, |
|
|
|
|
|
|
| Administrative |
3.4 |
6.1 |
8.4 |
10.3 |
18.7 |
30.1 |
| Product Fabricating, |
|
|
|
|
|
|
| Assembling and Repairing |
5.9 |
4.7 |
11.2 |
10.9 |
23.1 |
23.6 |
| Agriculture |
3.0 |
2.7 |
6.8 |
6.0 |
20.4 |
24.6 |
| Social Sciences |
1.4 |
2.0 |
1.1 |
1.5 |
43.6 |
48.9 |
| Processing and Machining |
2.2 |
1.8 |
9.0 |
7.8 |
12.2 |
14.2 |
| Artistic and Recreational |
1.1 |
1.4 |
1.3 |
1.7 |
33.3 |
37.8 |
| Natural Sciences |
0.8 |
1.3 |
4.7 |
5.1 |
9.1 |
15.3 |
| Materials Handling |
1.3 |
1.2 |
3.3 |
3.3 |
18.4 |
21.5 |
| Other Crafts and |
|
|
|
|
|
|
| Equipment |
0.5 |
0.6 |
1.8 |
1.8 |
12.8 |
17.9 |
| Transport Equipment |
|
|
|
|
|
|
| Operation |
0.4 |
0.5 |
6.3 |
6.0 |
3.1 |
6.1 |
| Construction Trades |
0.1 |
0.2 |
10.9 |
9.1 |
0.6 |
1.9 |
| Religion |
- - |
0.1 |
0.4 |
0.4 |
- - |
15.6 |
| Forestry and Logging, |
|
|
|
|
|
|
| Fishing Hunting and |
|
|
|
|
|
|
| Trapping |
-- |
-- |
1.1 |
1.5 |
-- |
-- |
| Mining and Quarrying |
-- |
-- |
0.9 |
0.9 |
-- |
-- |
| |
|
|
|
|
|
|
| TOTAL |
100.0 |
100.0 |
100.0 |
100.0 |
36.4 |
41.9 |
|
Source: "Labour Force Annual Averages 1975-1983", Statistics
Canada Catalogue 71-529; "The Labour Force", Statistics Canada Catalogue
71-001. |