Graphing
Essentials
By reading information from the following graphs we will determine some information about the workplace in Ontario.
Bar Graphs
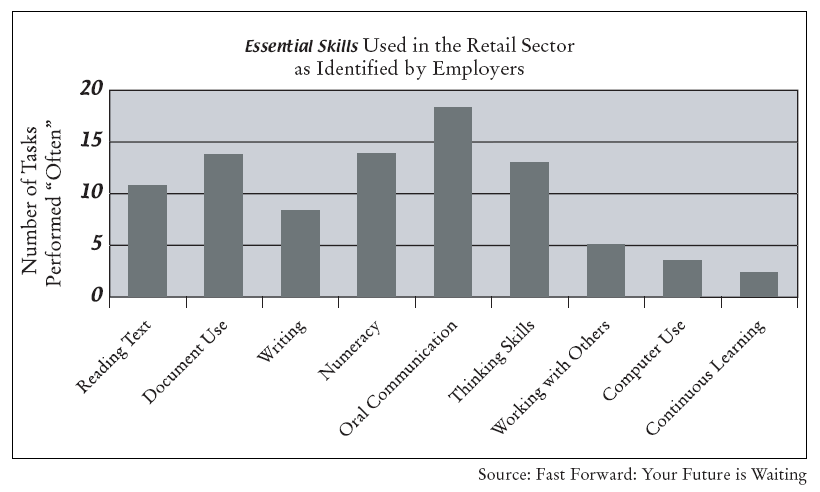
Example 1: Essential Skills Used in the Workplace
Which Essential Skill group do employers identify most often? ![]()
Is this skill most important? (circle one) Agree or Disagree
Why? ![]()
In each bar on the graph above, place the number of tasks performed in that skill category.
The total number of tasks identified is: ![]()
What percentage of the tasks is in the Numeracy category? (show work)