Graphing
Essentials
Bar graphs are used to make comparisons.
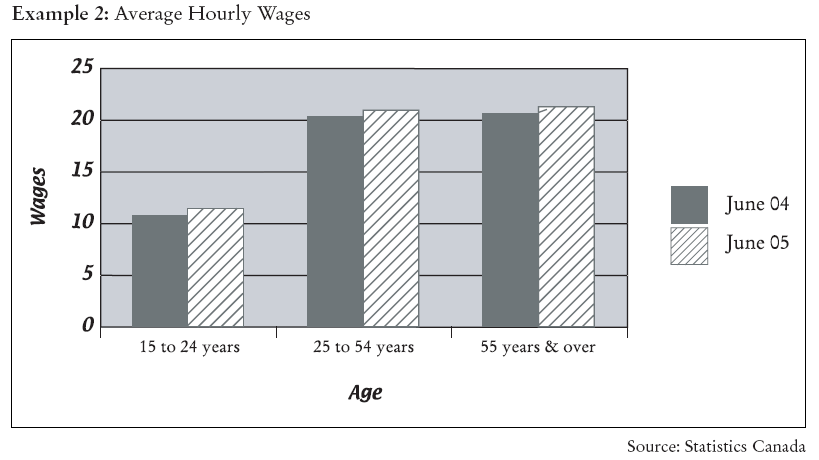
What is being compared in this bar graph? ![]()
What does the solid bar represent? ![]()
What does the striped bar represent? ![]()
Which age groups’ wages increased the most from 2004 to 2005? ![]()
What is the hourly wage for each age group in June 2005?
15 – 24 years ![]() 25 – 54 years
25 – 54 years ![]() 55 years and over
55 years and over ![]()
How accurate are your answers? Explain ![]()