Graphing
Essentials
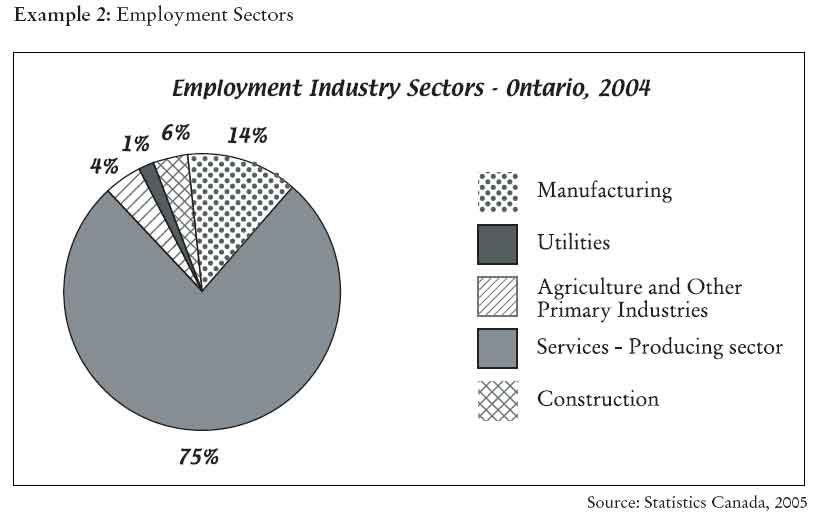
Agriculture, Utilities, Construction and Manufacturing make up what is called the Goods- Producing Sector.
What percentage of jobs in 2004 were in the Goods-Producing Sector? ![]()
What is the ratio of Services-Producing jobs to Goods-Producing jobs? ![]()
If 6,000,000 people were employed in Ontario in 2004, how many people would be
employed in the Construction Industry? (show your work)