Graphing
Essentials
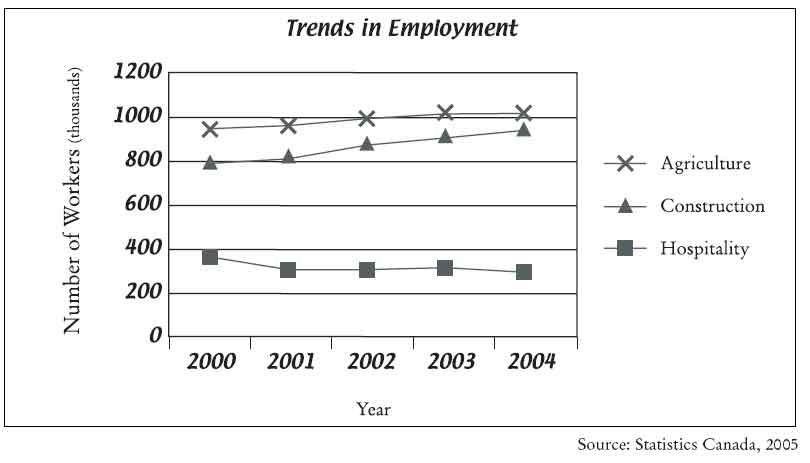
Explain what the information in the line graph is trying to show?
On the line graph above, using different coloured pens, pencils, or highlighters, circle the
following in a different colour:
Complete the following chart:
| INDUSTRY | NUMBER OF WORKERS IN 2000 | NUMBER OF WORKERS IN 2004 | CHANGE IN WORKERS | |
|---|---|---|---|---|
| Agriculture | ||||
| Construction | ||||
| Hospitality |