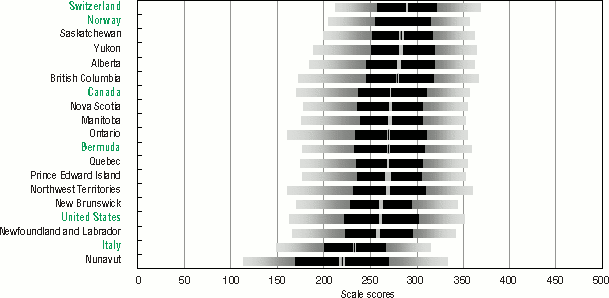
Figure 1.3 C and D (concluded)

Notes: Countries, Canadian provinces and territories are ranked
by average scores for each domain.
The province of Nuevo Leon in Mexico did not field the numeracy
domain.
Switzerland (Italian), the United States, and the province of
Nuevo Leon in Mexico did not field the problem solving domain.
Source: Adult Literacy and Life Skills Survey, 2003; International Adult Literacy and Skills Survey, 2003.