Proficiencies and gender

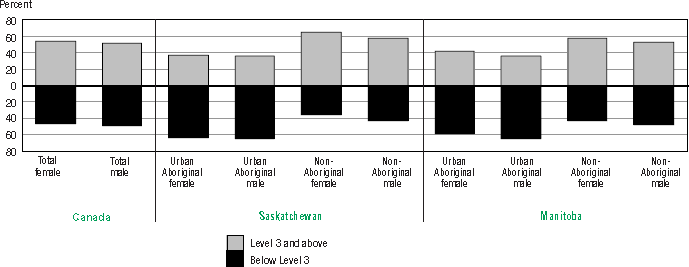
For the Aboriginal populations surveyed, there are few differences between females and males in either the proportion scoring below Level 3 prose literacy proficiency or in their average prose literacy scores (Figures 3.8 to 3.11).

Figure 3.8

Distribution of prose proficiency, by percentage below Level 3, at or above Level 3,
by gender, urban Aboriginal and non-Aboriginal populations, Canada, Saskatchewan and Manitoba,
population aged 16 and over, 2003

Bar graph representation of Table 3.8


Source: International Adult Literacy and Skills Survey, 2003.

Figure 3.9

Distribution of prose proficiency, by percentage below Level 3, at or above Level 3,
by gender, urban Aboriginal and non-Aboriginal populations, Canada and Northern Territories,
population aged 16 and over, 2003

Bar graph representation of Table 3.9


Note: This figure contains certain unreliable estimates. Consult the table 3.9 in Annex A for the standard error of each estimate.

Source: International Adult Literacy and Skills Survey, 2003.