Average prose proficiency scores with .95 confidence interval
and scores at the 5th, 25th, 75th
and 95th percentiles by gender, Canada, urban Aboriginal
and non-Aboriginal populations
in Manitoba and Saskatchewan, 16 and over, 2003


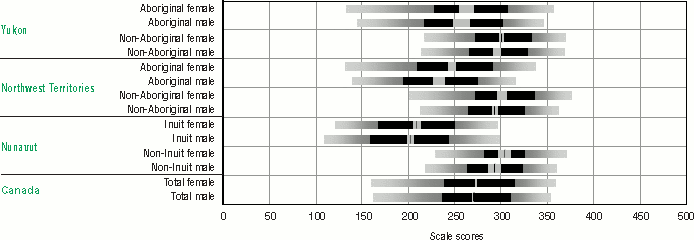
Average prose proficiency scores with .95 confidence interval
and scores at the 5th, 25th, 75th
and 95th percentiles, by gender, Aboriginal and non-Aboriginal
populations,
Canada, Yukon, Northwest Territories and Nunavut, population
aged 16 and over, 2003


