|
CHART 4
Providers of Adult Education
(as % of
courses taken in 1983)
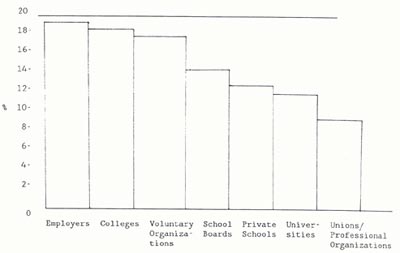
Source: Statistics Canada 1984, in CAAE, Analysis of the
Statistics Canada Adult Education Survey, January, 1984.
TABLE 7
Duration of Retraining Programs Resulting
From Technological Change, by Method
of Training, Canada, 1980-85
|
Proportion of Total
Programs |
|
in Each Category: |
|
On-the-Job |
Classroom |
Total |
| Number of Weeks: |
|
(Per cent) |
|
| One |
18.6 |
56.0 |
20.3 |
| 2 - 4 |
32.3 |
27.2 |
30.4 |
| 5 - 12 |
16.3 |
9.5 |
17.6 |
| 13 - 26 |
24.6 |
5.7 |
18.6 |
| More than 26 |
8.2 |
1.6 |
13.1 |
| |
|
|
|
| TOTAL |
100.0 |
100.0 |
100.0 |
|
Source: Based on the Working with Technology Survey, Economic
Council of Canada, 1985. |